- What we do
- Works
- Pricing
- Insights
- Company
- Contact Us

December 11, 2020
How to Analyze the App’s Performance: A List of KPIs to Follow – Part One
All businesses who go digital want to be successful. A huge amount of time, money, and energy is spent on software development and project support, including online marketing. However, sometimes the result of the work doesn’t meet expectations and can often be attributed to the lack of clear planning and evaluation of the effectiveness of the work done. Here are some of the most efficient KPIs that help you track your app’s marketing performance!
Increasing sales and revenue is a sign that your business is moving in the right direction. However, don’t relax too much, as you still need to know how effective your marketing efforts are and which channels you can improve.
In this article, we’ve decided to talk about what a KPI is, how it's useful, and also collected the main metrics that will help you check how well your marketing activities fit your product.
What is a KPI in Internet marketing?
The effectiveness of Internet marketing is measured using a large number of indicators called KPIs, or key performance indicators. These are a set of metrics that allow you to objectively evaluate the performance of an application, including the effectiveness of advertising.
The business task should include three factors:
- Amount
- Price
- Quality
If at least one of the factors is omitted, the performance evaluation will be incomplete.
It’s good to note that even though these metrics are basic, there are no universal indicators of these metrics and since all applications are quite different, what will be good for one may indicate problems for another.
Marketing KPIs: Types and methods of evaluation.
App Installs and CPI
The first indicator that shows your app’s success is App Installs, which is the whole number of times your app was installed on various devices. This metric says something about your product’s popularity, but without taking into account other indicators, it’s hard to say whether this number really means a lot.
The first significant indicator that works together with App Installs is the CPI (Cost Per Install). Based on the name of the indicator itself, it's clear what information it carries: the cost per app installation. It may seem that having a low CPI is good, but be careful: If the cost to install the app is very cheap, this doesn't mean that we have a large, responsible, high-quality audience. This is likely an insolvent audience that is willing to use the app for free or only through the trial periods.
When is a low installation cost really beneficial? Well, when we use advertising for a mobile game, and monetization is not based on a subscription model, but in-app advertising. In this case, people don't actually pay for anything, they just watch ads, and we earn money from the advertising inside the app. So it's more profitable to make the app installations as cheap as possible.
If our monetization model is based on subscriptions, it will be beneficial to keep the CPI low too. But it will not be as low as in the case of monetization through in-app advertising.
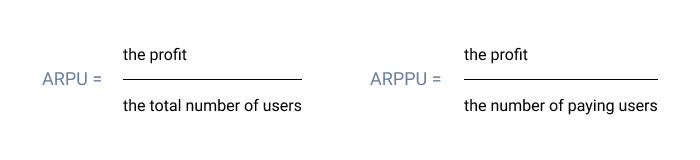
ARPU and ARPPU
The first abbreviation stands for Average Revenue Per User, and the second is Average Revenue Per Paid User. In the first case, the indicator is calculated quite simply – we divide our profit by the total number of users. In the second case, you need to divide the profit by the number of paying users. This is necessary to estimate the total profit from one of our clients for the entire period of working with them. The higher the number, the better, since it indicates that your app is making a profit!
Lifetime value
LTV, or Lifetime Value, is responsible for the app’s revenue received from one user. It depends on the period of time each user spends using the app, or in other words, a lifetime. In apps with a subscription monetization model, a settled amount of money will be withdrawn from a person's account after a certain timeframe: once a week, a month, or a year. And to calculate the LTV, you need to multiply its lifetime by the subscription price.
For example, our app has a weekly subscription that costs $5. If a person used the app for four weeks and the payment was made four times, but then they canceled the subscription and/or deleted the app, their lifetime will be four weeks. As a result, their LTV will be $20.
The higher the LTV is, the more high-quality the product. It means that the content and functionality of the app are useful and user-friendly enough for people to stay loyal and pay for it.
Retention rate
The function of the Retention Rate metric is also obvious from its name: It indicates the user's retention level in the app. This indicator is calculated very easily, using the number of users the app has at the moment divided by the total number of users who used a product within a certain period. Usually, this metric is counted on a specific day, for example, a week or two after the app is installed.
So, the retention rate after 14 days will look like this:
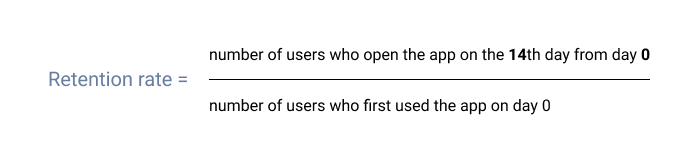
The higher this indicator, the better, because it means that users return to the app again and again. It’s not just a one-time visit, and the app is useful and interesting. Besides, if the Retention Rate of the application is high, then the LTV will be quite high too.
Active users
It's worth mentioning such metrics as Daily Active Users, Weekly Active Users, and Monthly Active Users. This is the number of unique users who logged into the app on a specific day, week, or month. It helps you determine user activity over a certain timeframe.
To sum it up
Successful companies track metrics so that their marketing campaigns are profitable. If you haven't tracked metrics related to your marketing campaigns, it's certainly not too late to start. Some of these metrics will be specific to individual campaigns, while others should be tracked over time to help you create tracking templates. You can also hire a marketing agency that will help you with the task, but make sure you know how to deal with time zone differences if your partner is offshore.
Part one of the KPIs list is over. Stay tuned for part two, where we complete the list and give advice on some services to use to track the mentioned metrics!
If you've got any questions, just contact us and we'll be right there for you
Your friends at YellowGot a project in mind?
Fill in this form or send us an e-mail
Subscribe to new posts.
Get weekly updates on the newest design stories, case studies and tips right in your mailbox.