Analytics Tools for Carbon Footprint Tracking Platform
How we optimized maps, implemented analytics tools, and optimized the platform.
Sustainable production
3 months
Web development
Web

Project Idea
Our client is a global service that allows its users to track CO2 emissions from farms and land plots. The company needed a hand with the platform’s frontend: It required a set of analytics tools and optimized map clustering to upgrade the user experience.
The client had
A functional platform
We were responsible for
Building analytics tools
Optimizing map clustering
Integrating new API
Project team
Project manager
Two frontend engineers (React)
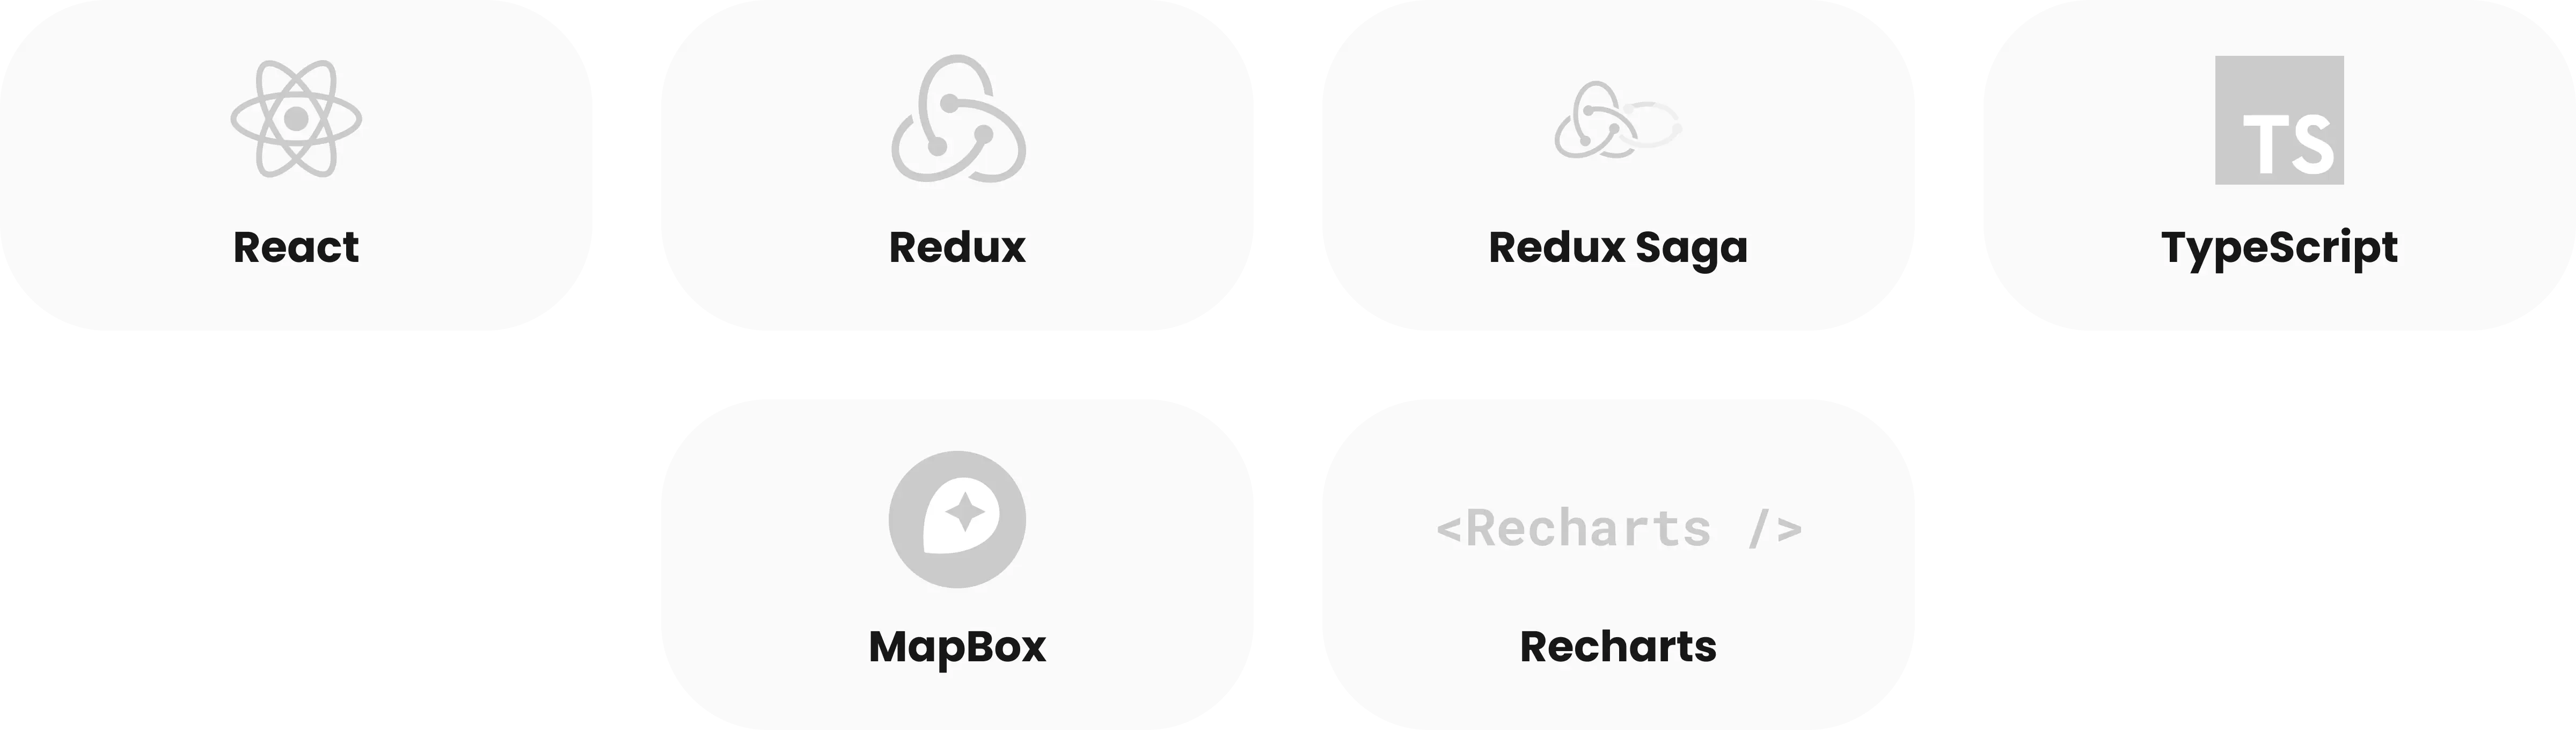
Technology Stack

Key features
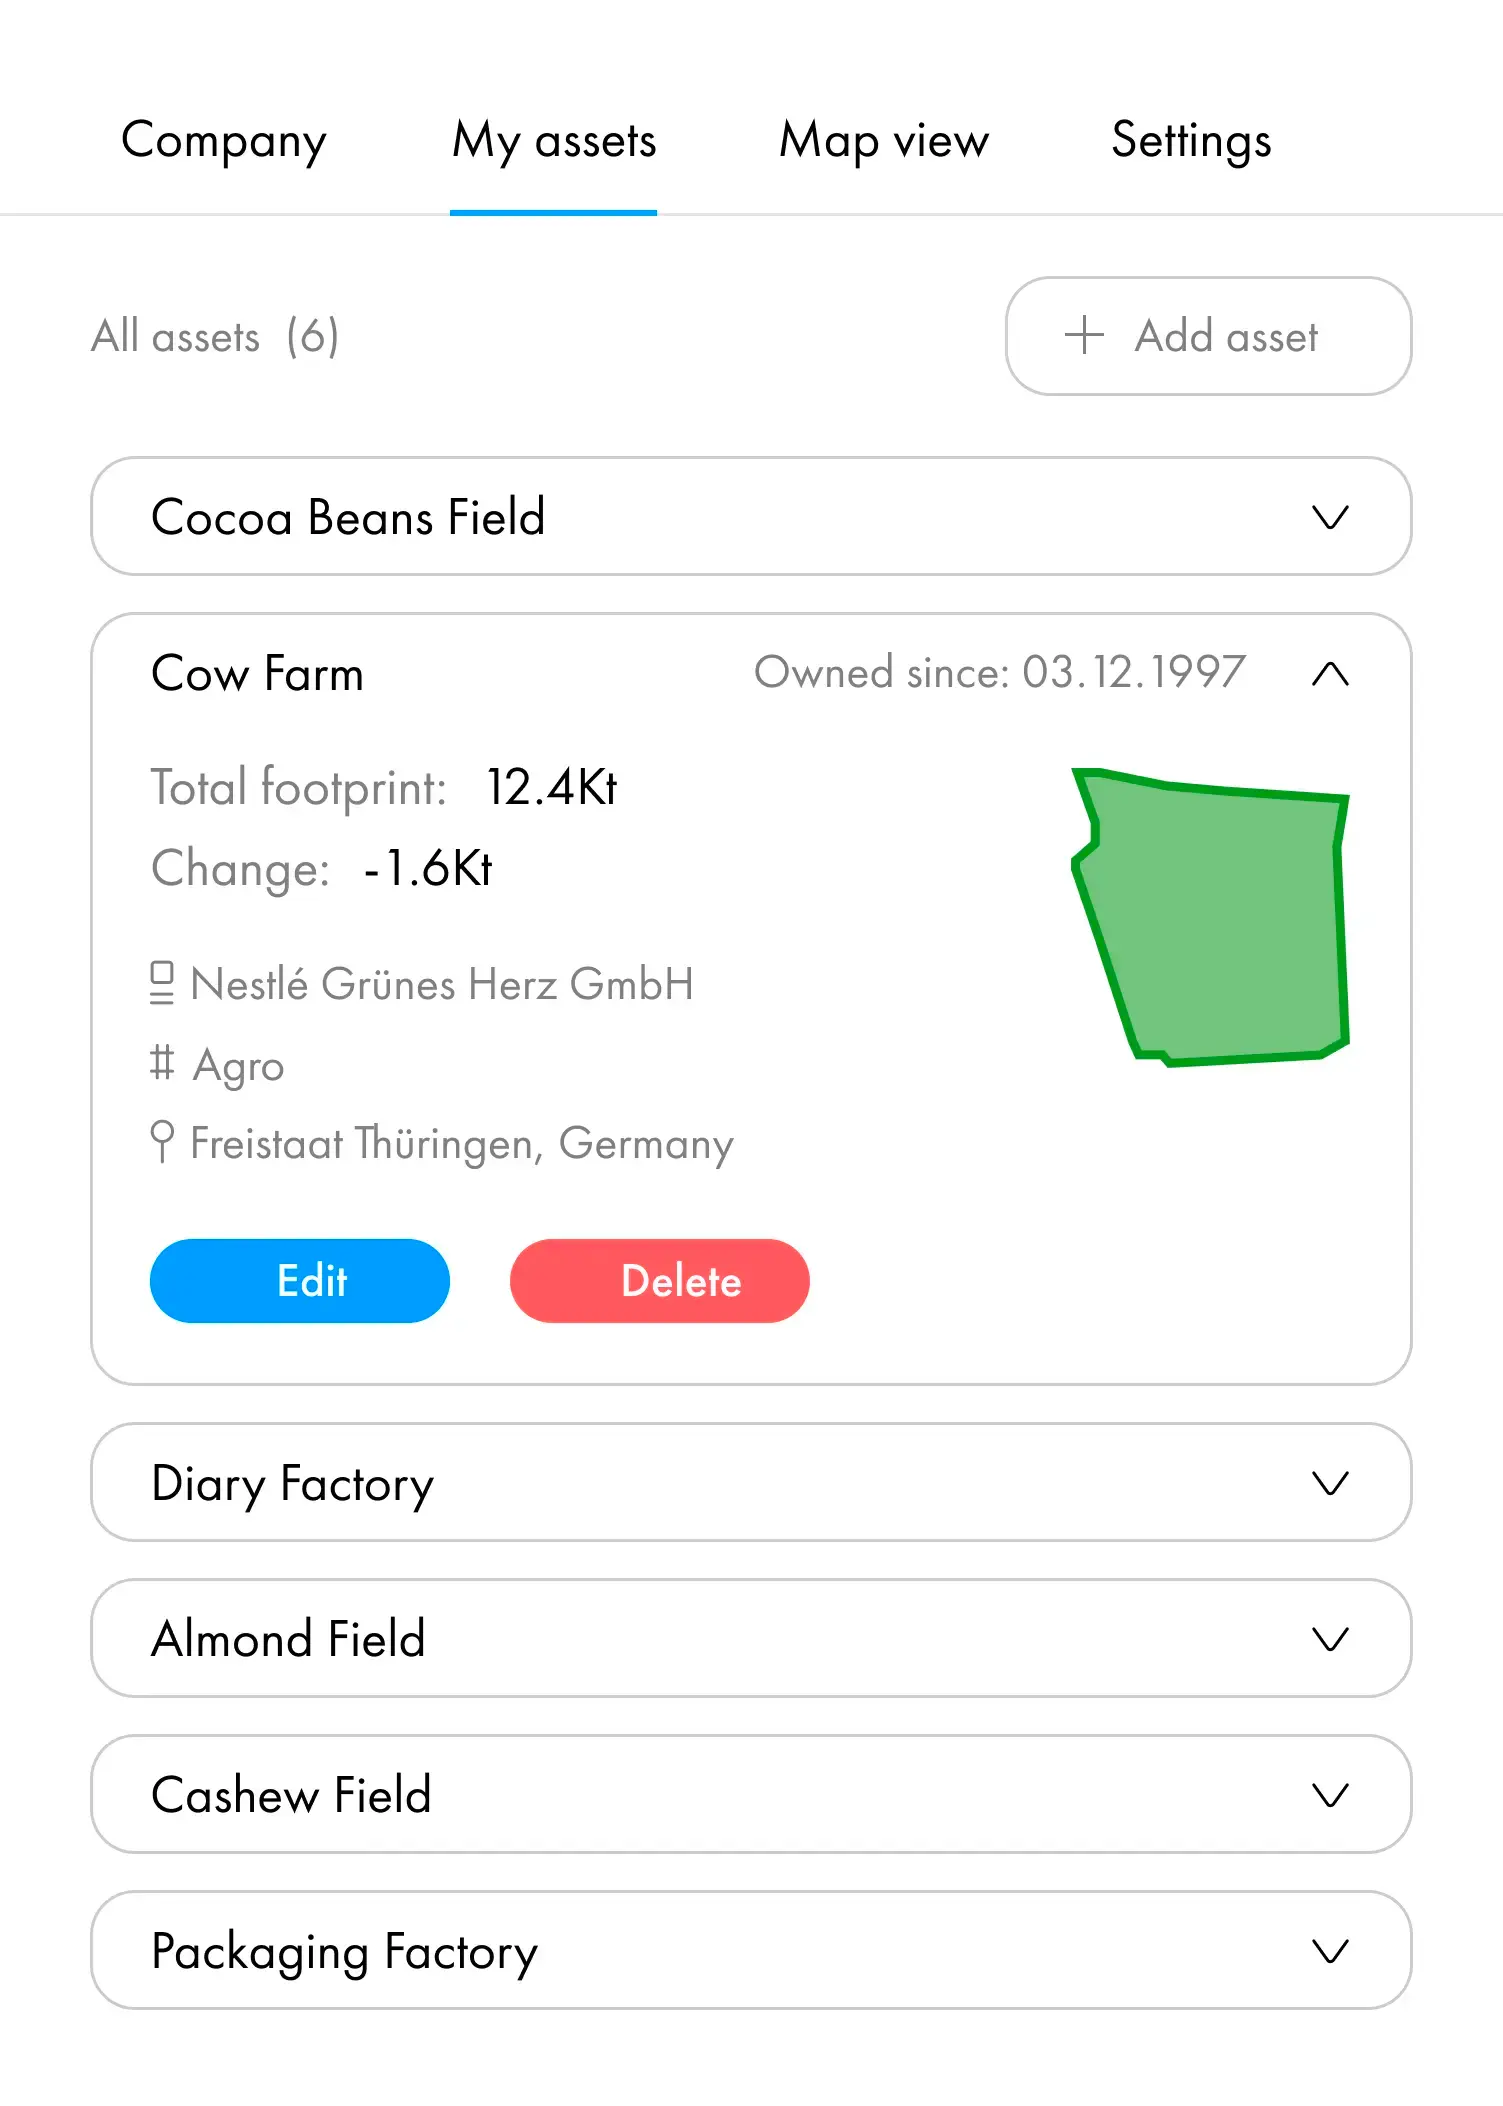
Maps
Map clustering algorithm
Color schemes for different pollution levels (Red for high CO2 pollution level. Green for low CO2 pollution level)
Dynamic side panel with information about clusters (Country/state/city, general area, the number of fields, CO2 pollution index)
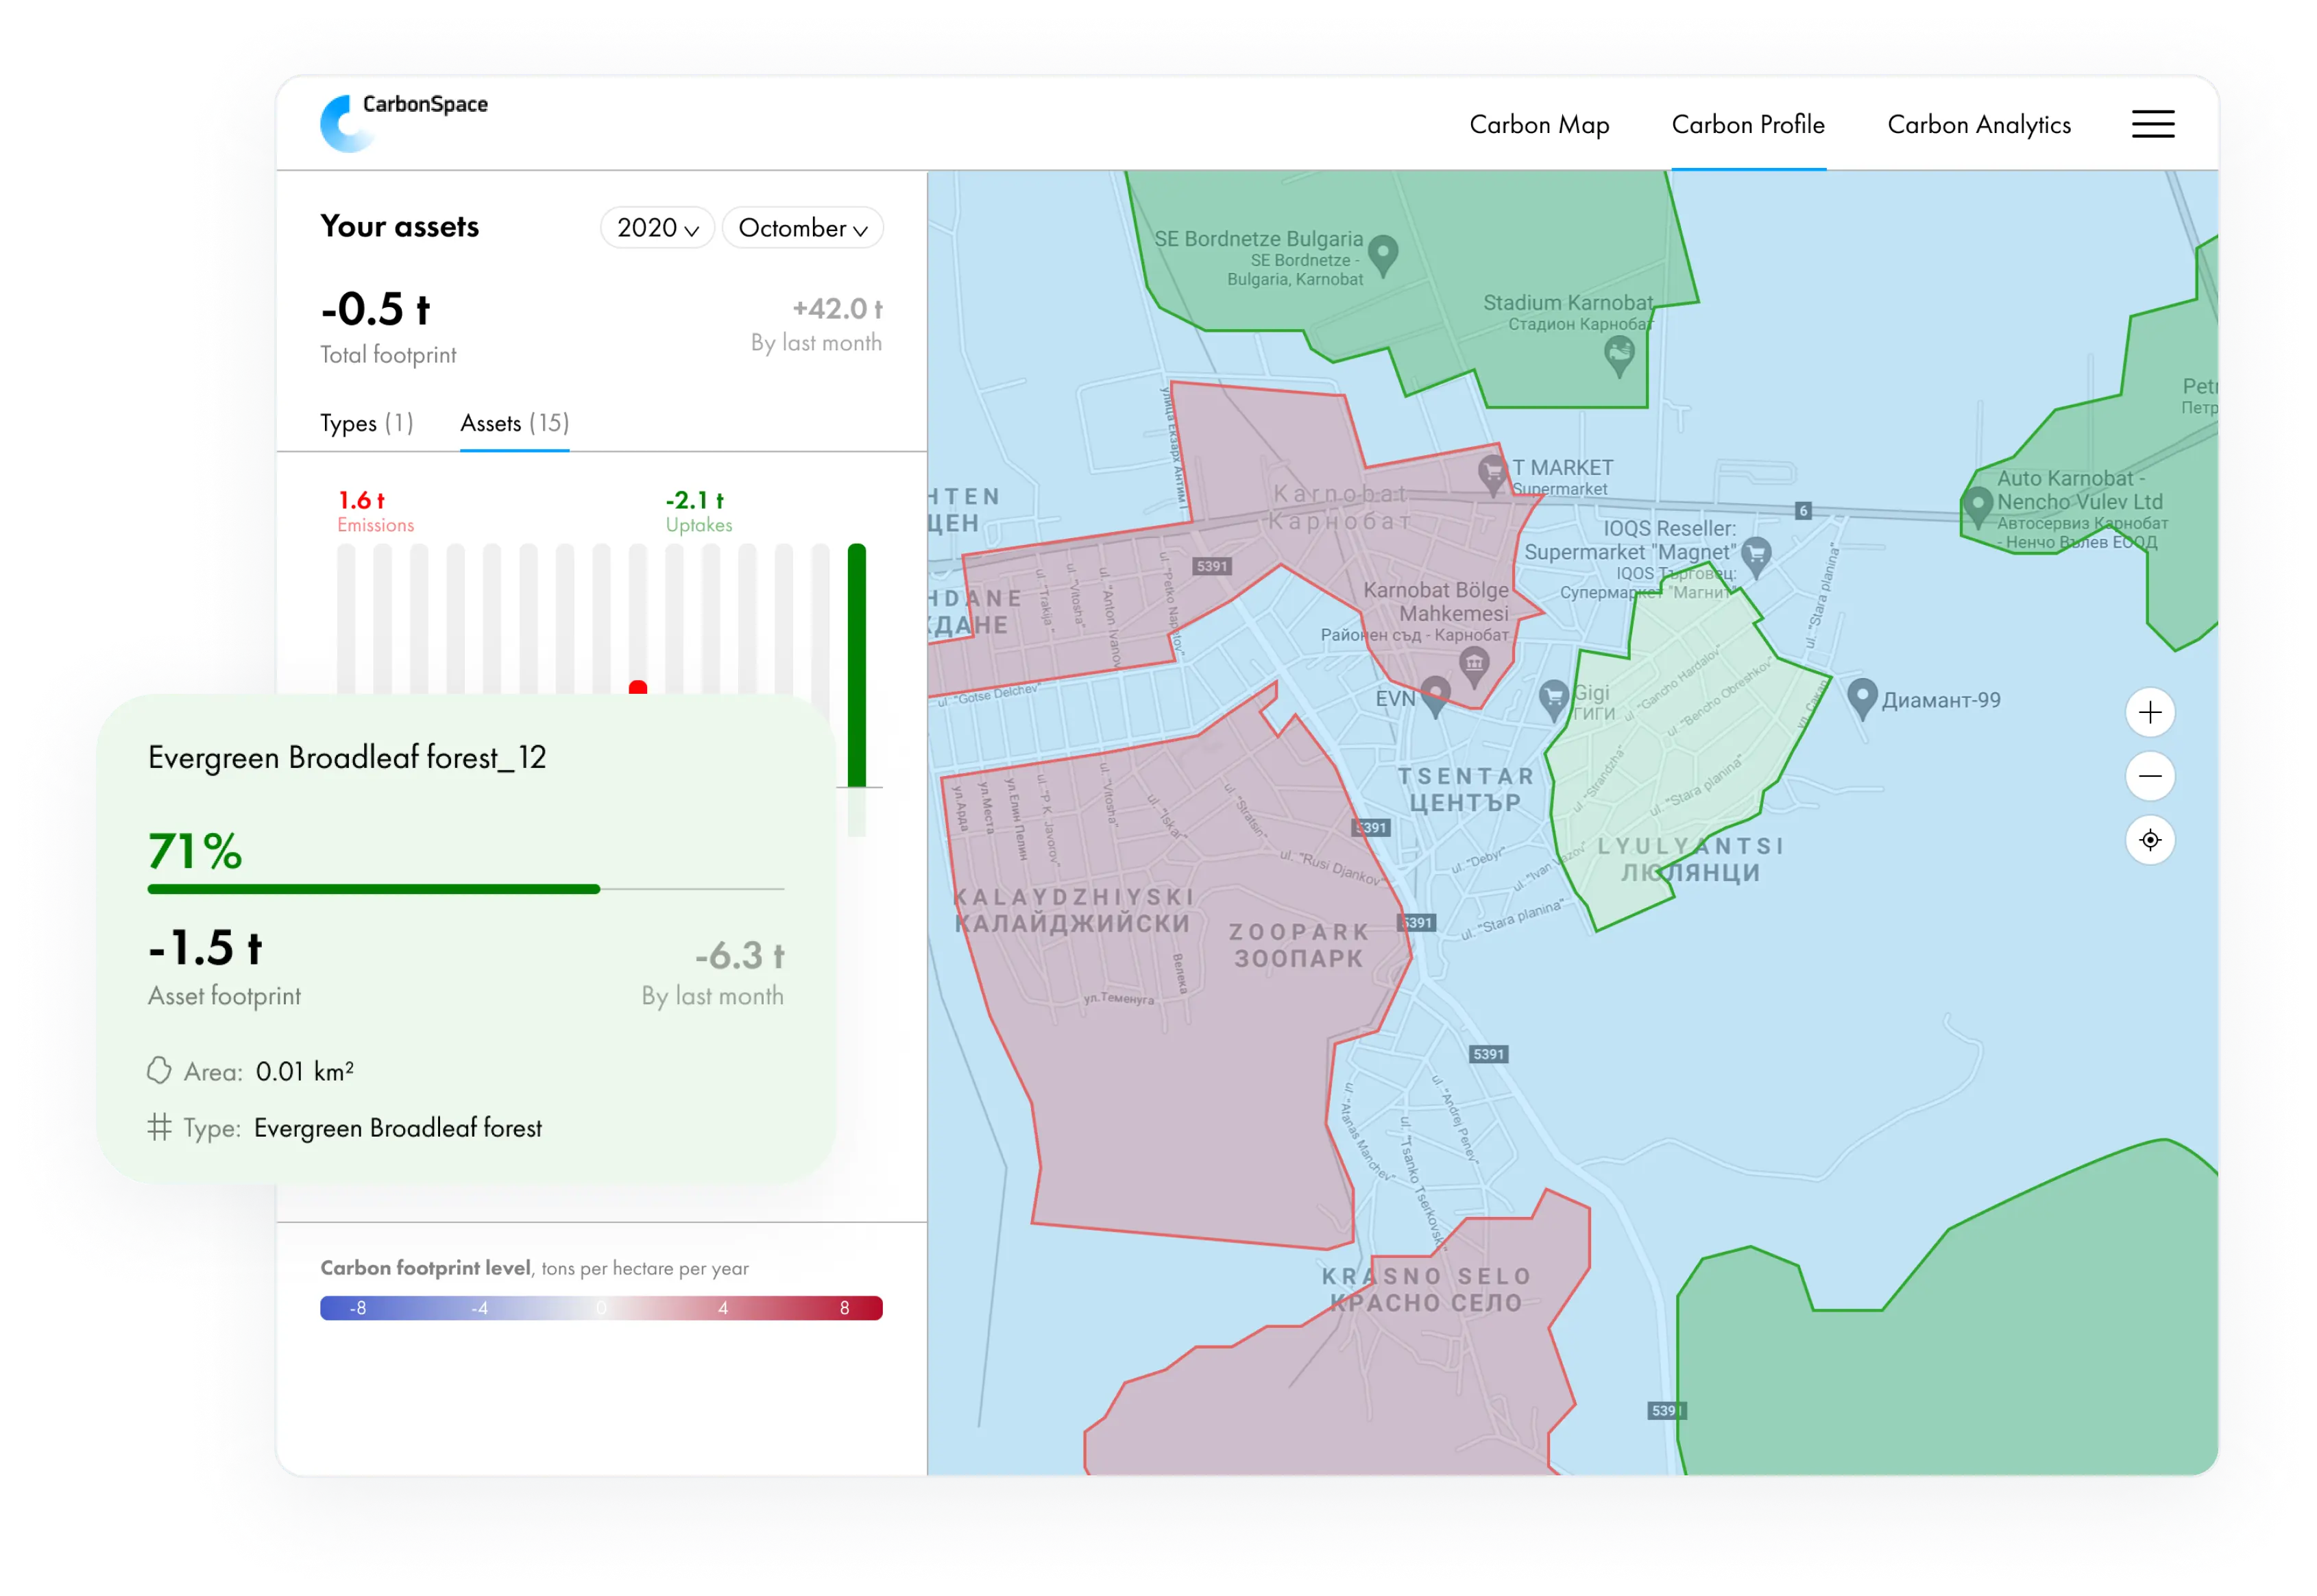
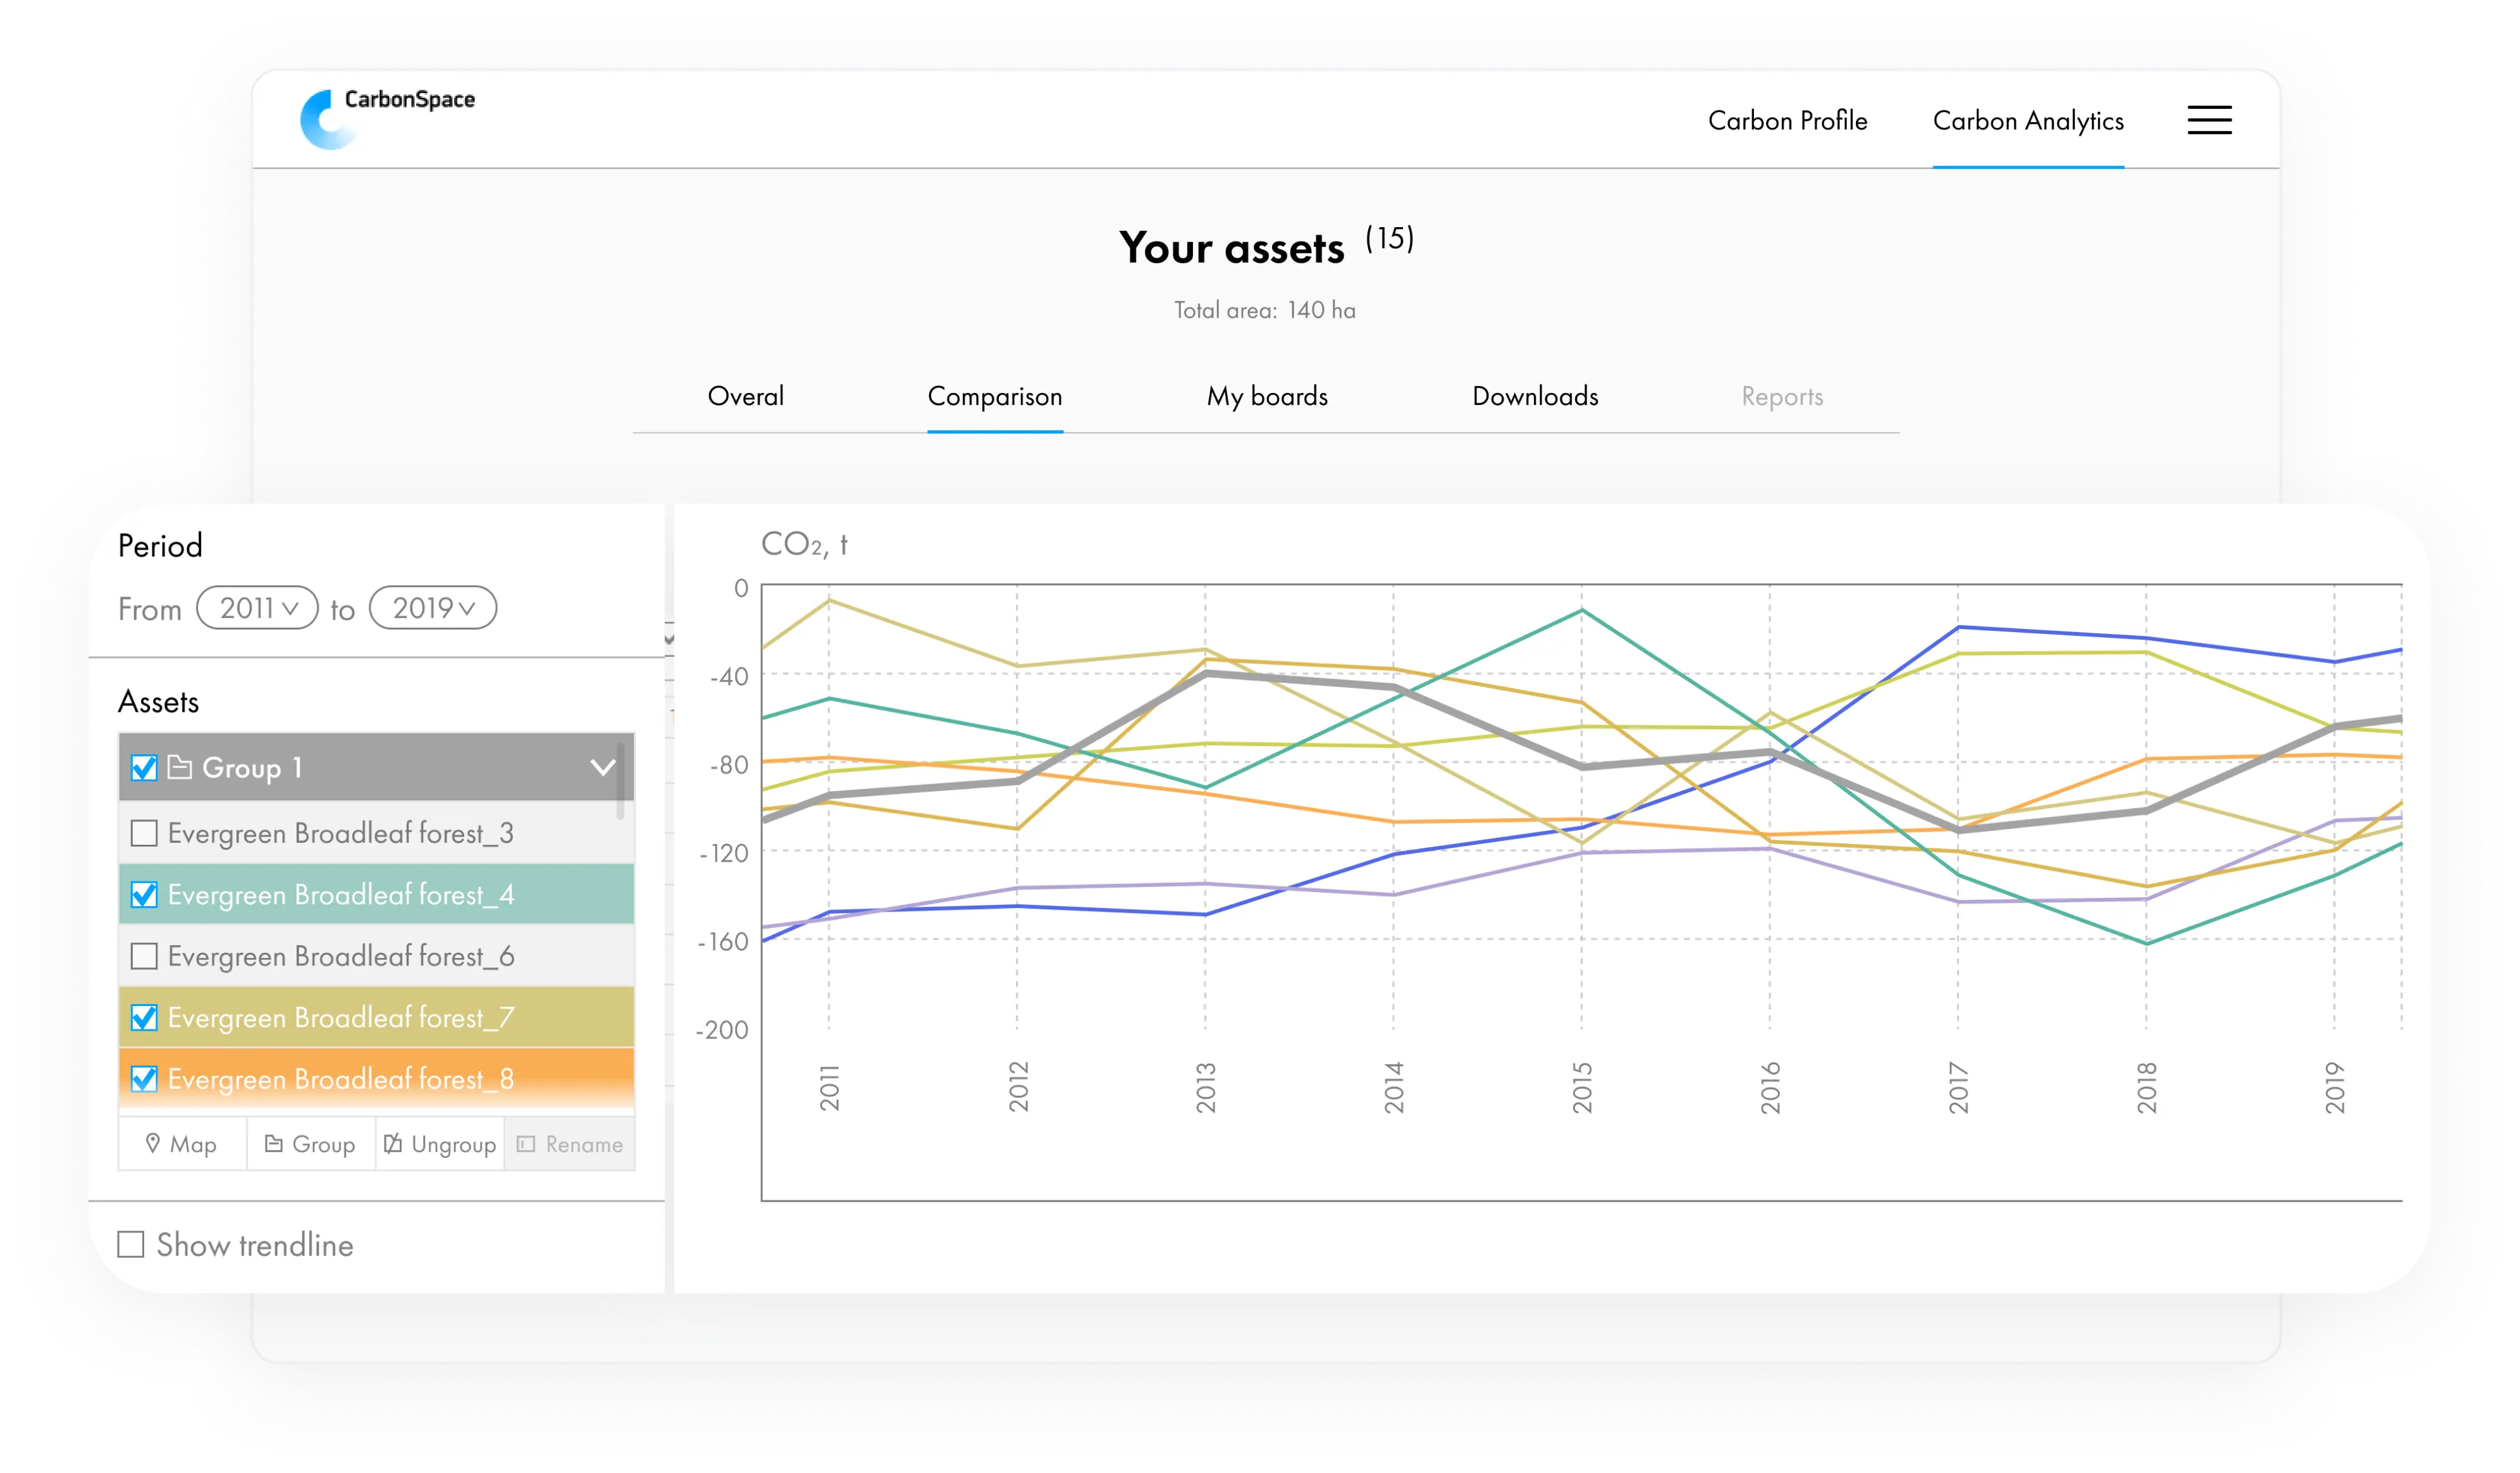
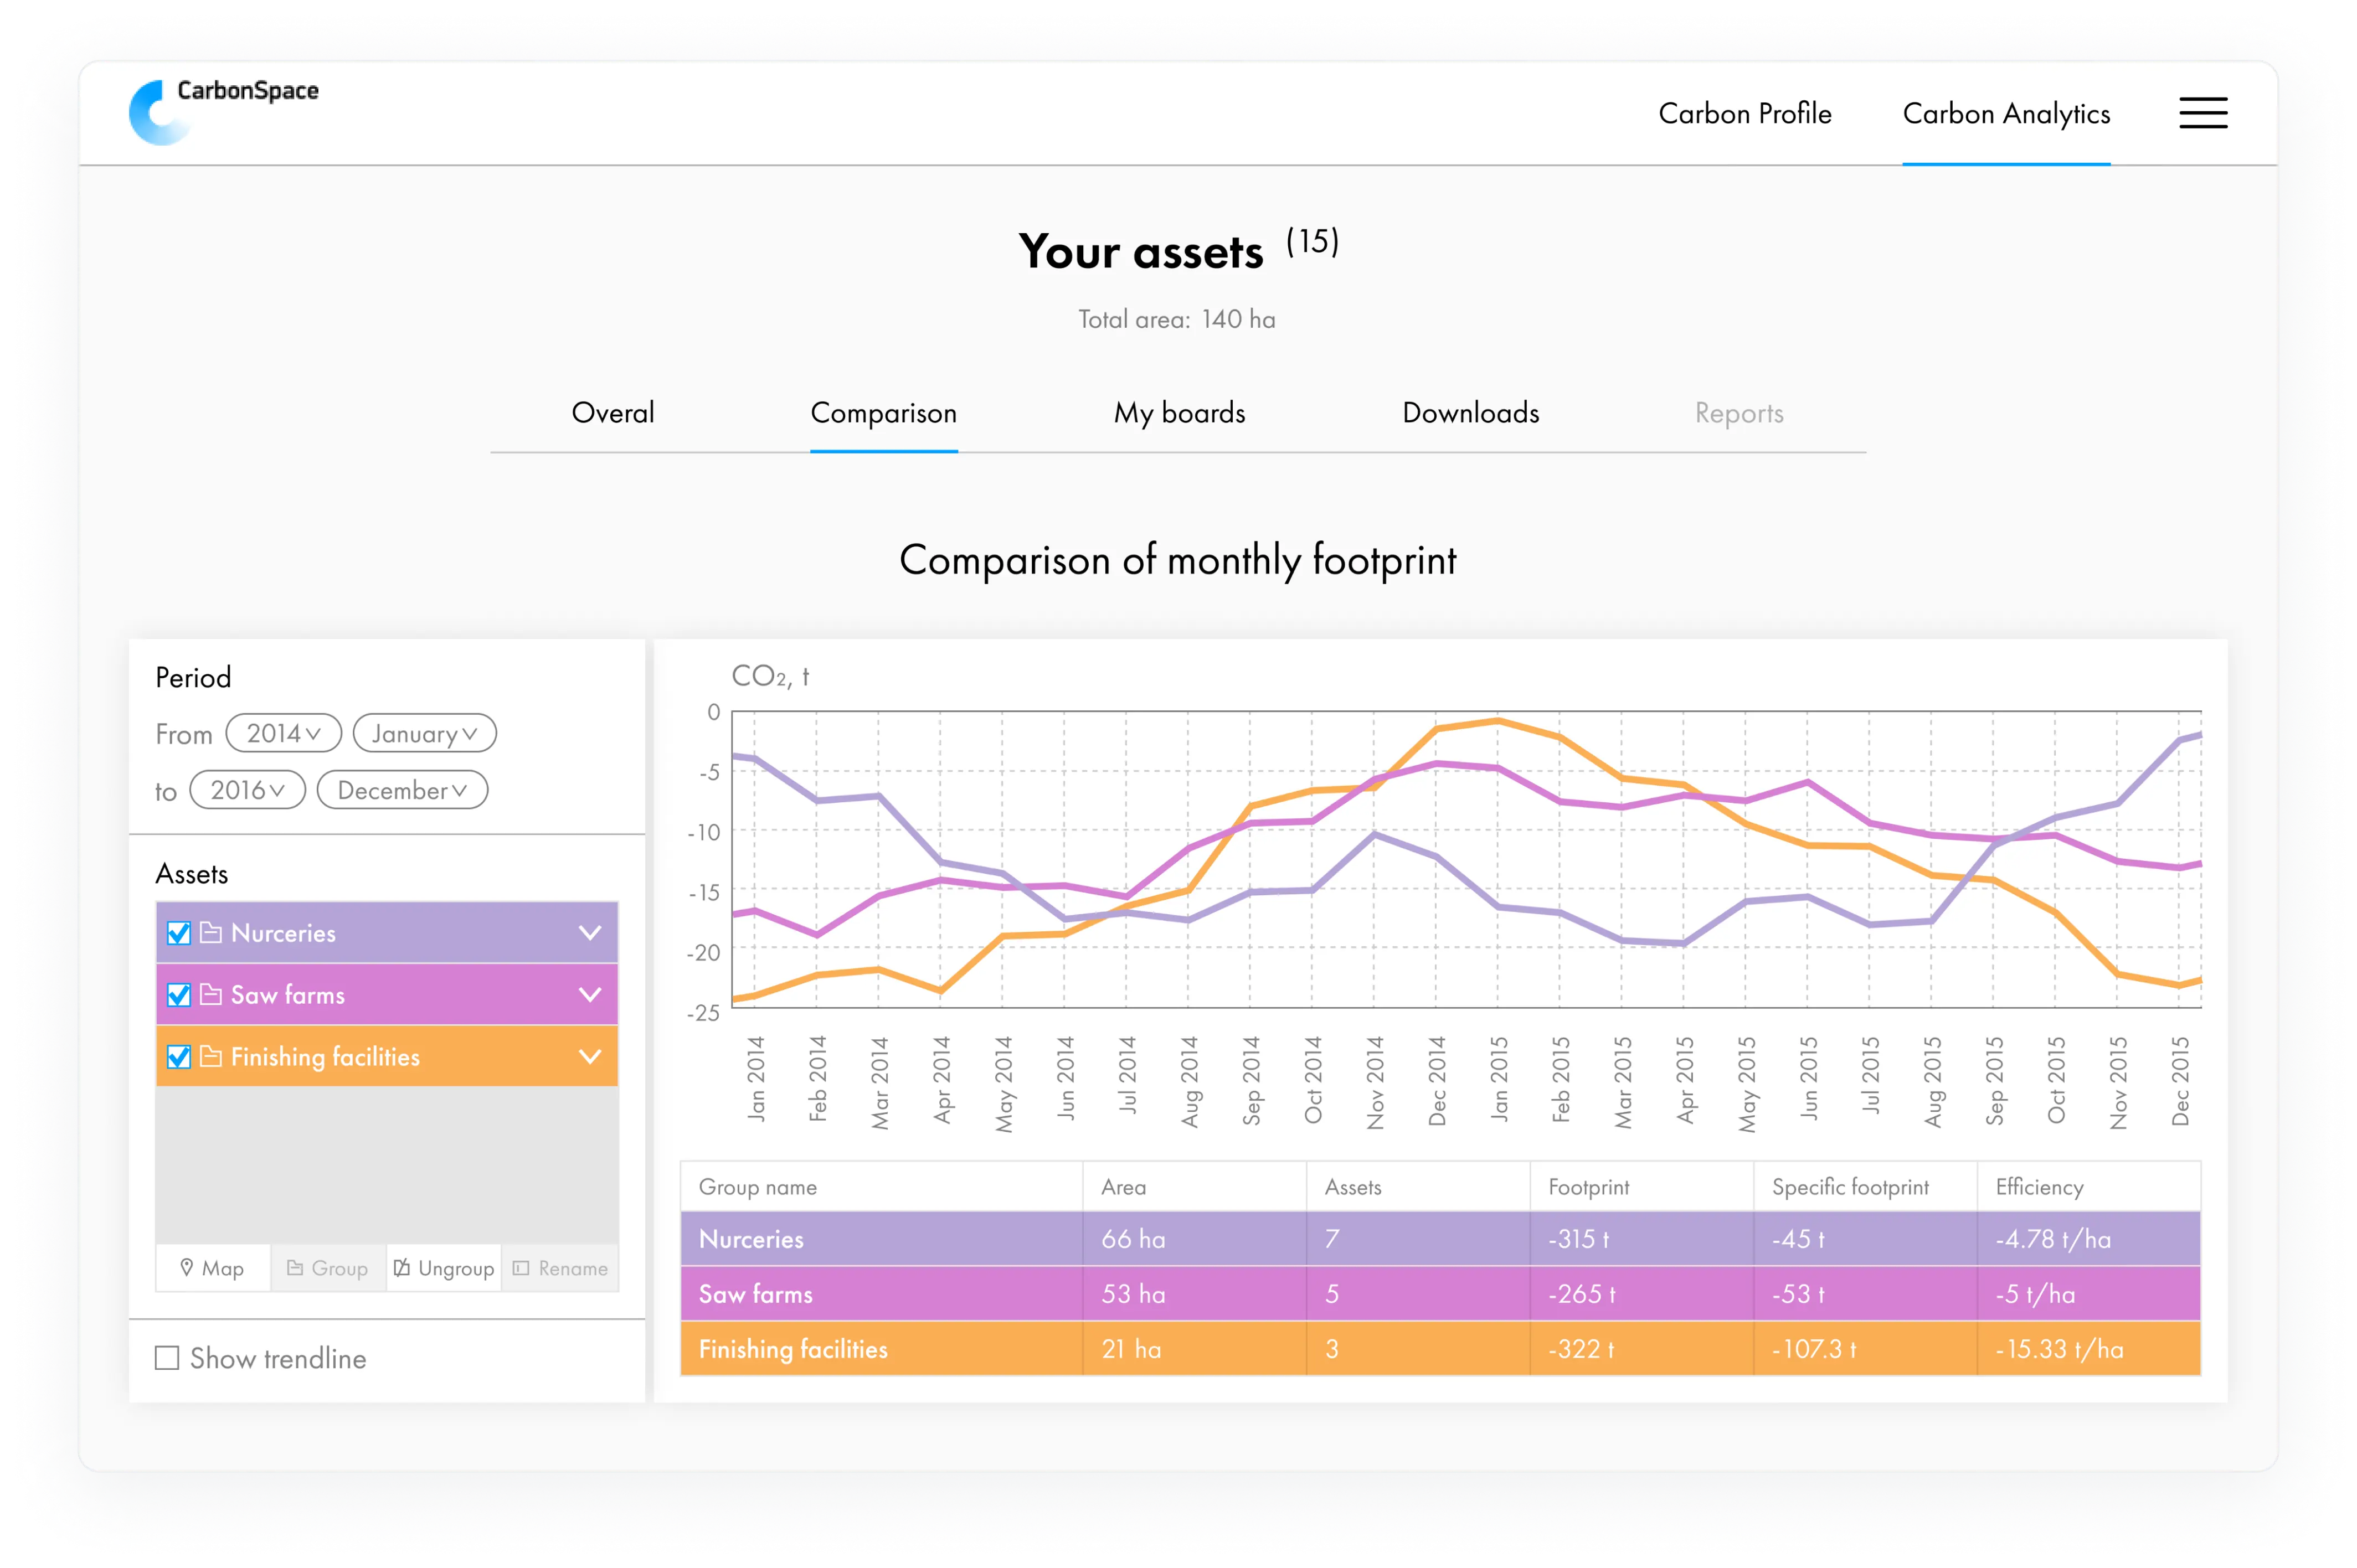
Analytics
Side analytics for seeing data by fields that are displayed specifically on the map
Custom charts
The ability to download the report

API integration
Optimized client-side and server-side
Data caching for faster loading
Challenges and Solutions
Optimizing maps and API integration
Problem:
We needed to implement statistics screens that would show relevant data about farm territories. Statistics show a detailed report on all polluted and clean zones. This feature should also allow users to create custom widgets with specified presets for the observation period.
Solution:
We developed map rendering and clustering methods to reduce the number of requests to the server and the load on the user's device when rendering the map. We also implemented custom rendering of React components for dynamic widgets and user statistics screens.
Results
The algorithms we implemented showed high application performance in the Lighthouse test.
The platform became flexible so new functions can be added without damaging app metrics.